 Dublin, Ireland
 Monitoring Financial & Stock Markets on Grafana 📈
TL;DR: A Docker Compose stack that polls yfinance for stock, ETF, commodity, forex, and crypto prices, stores them in TimescaleDB with a two-tier daily/intraday data model, and serves pre-built Grafana dashboards. Backfills years of history on first run, then polls every 15 minutes. Ships with 29 default symbols and a Kustomize-based Kubernetes deployment.
GitHub: github.com/atas/markets-o11y
graph LR
    I(["Initial Run<br/><i>backfills 10 years<br/>daily data</i>"])
    W["worker<br/><i>polls</i>"]
    T["TimescaleDB<br/><i>storage</i>"]
    G["Grafana<br/><i>UI</i>"]

    I -- "run in the bg" --> W
    W -- "every 15min" --> T
    G -- "visualizes<br/>dashboards + alerts" --> T
    G -- "📊" --> Y["You"]
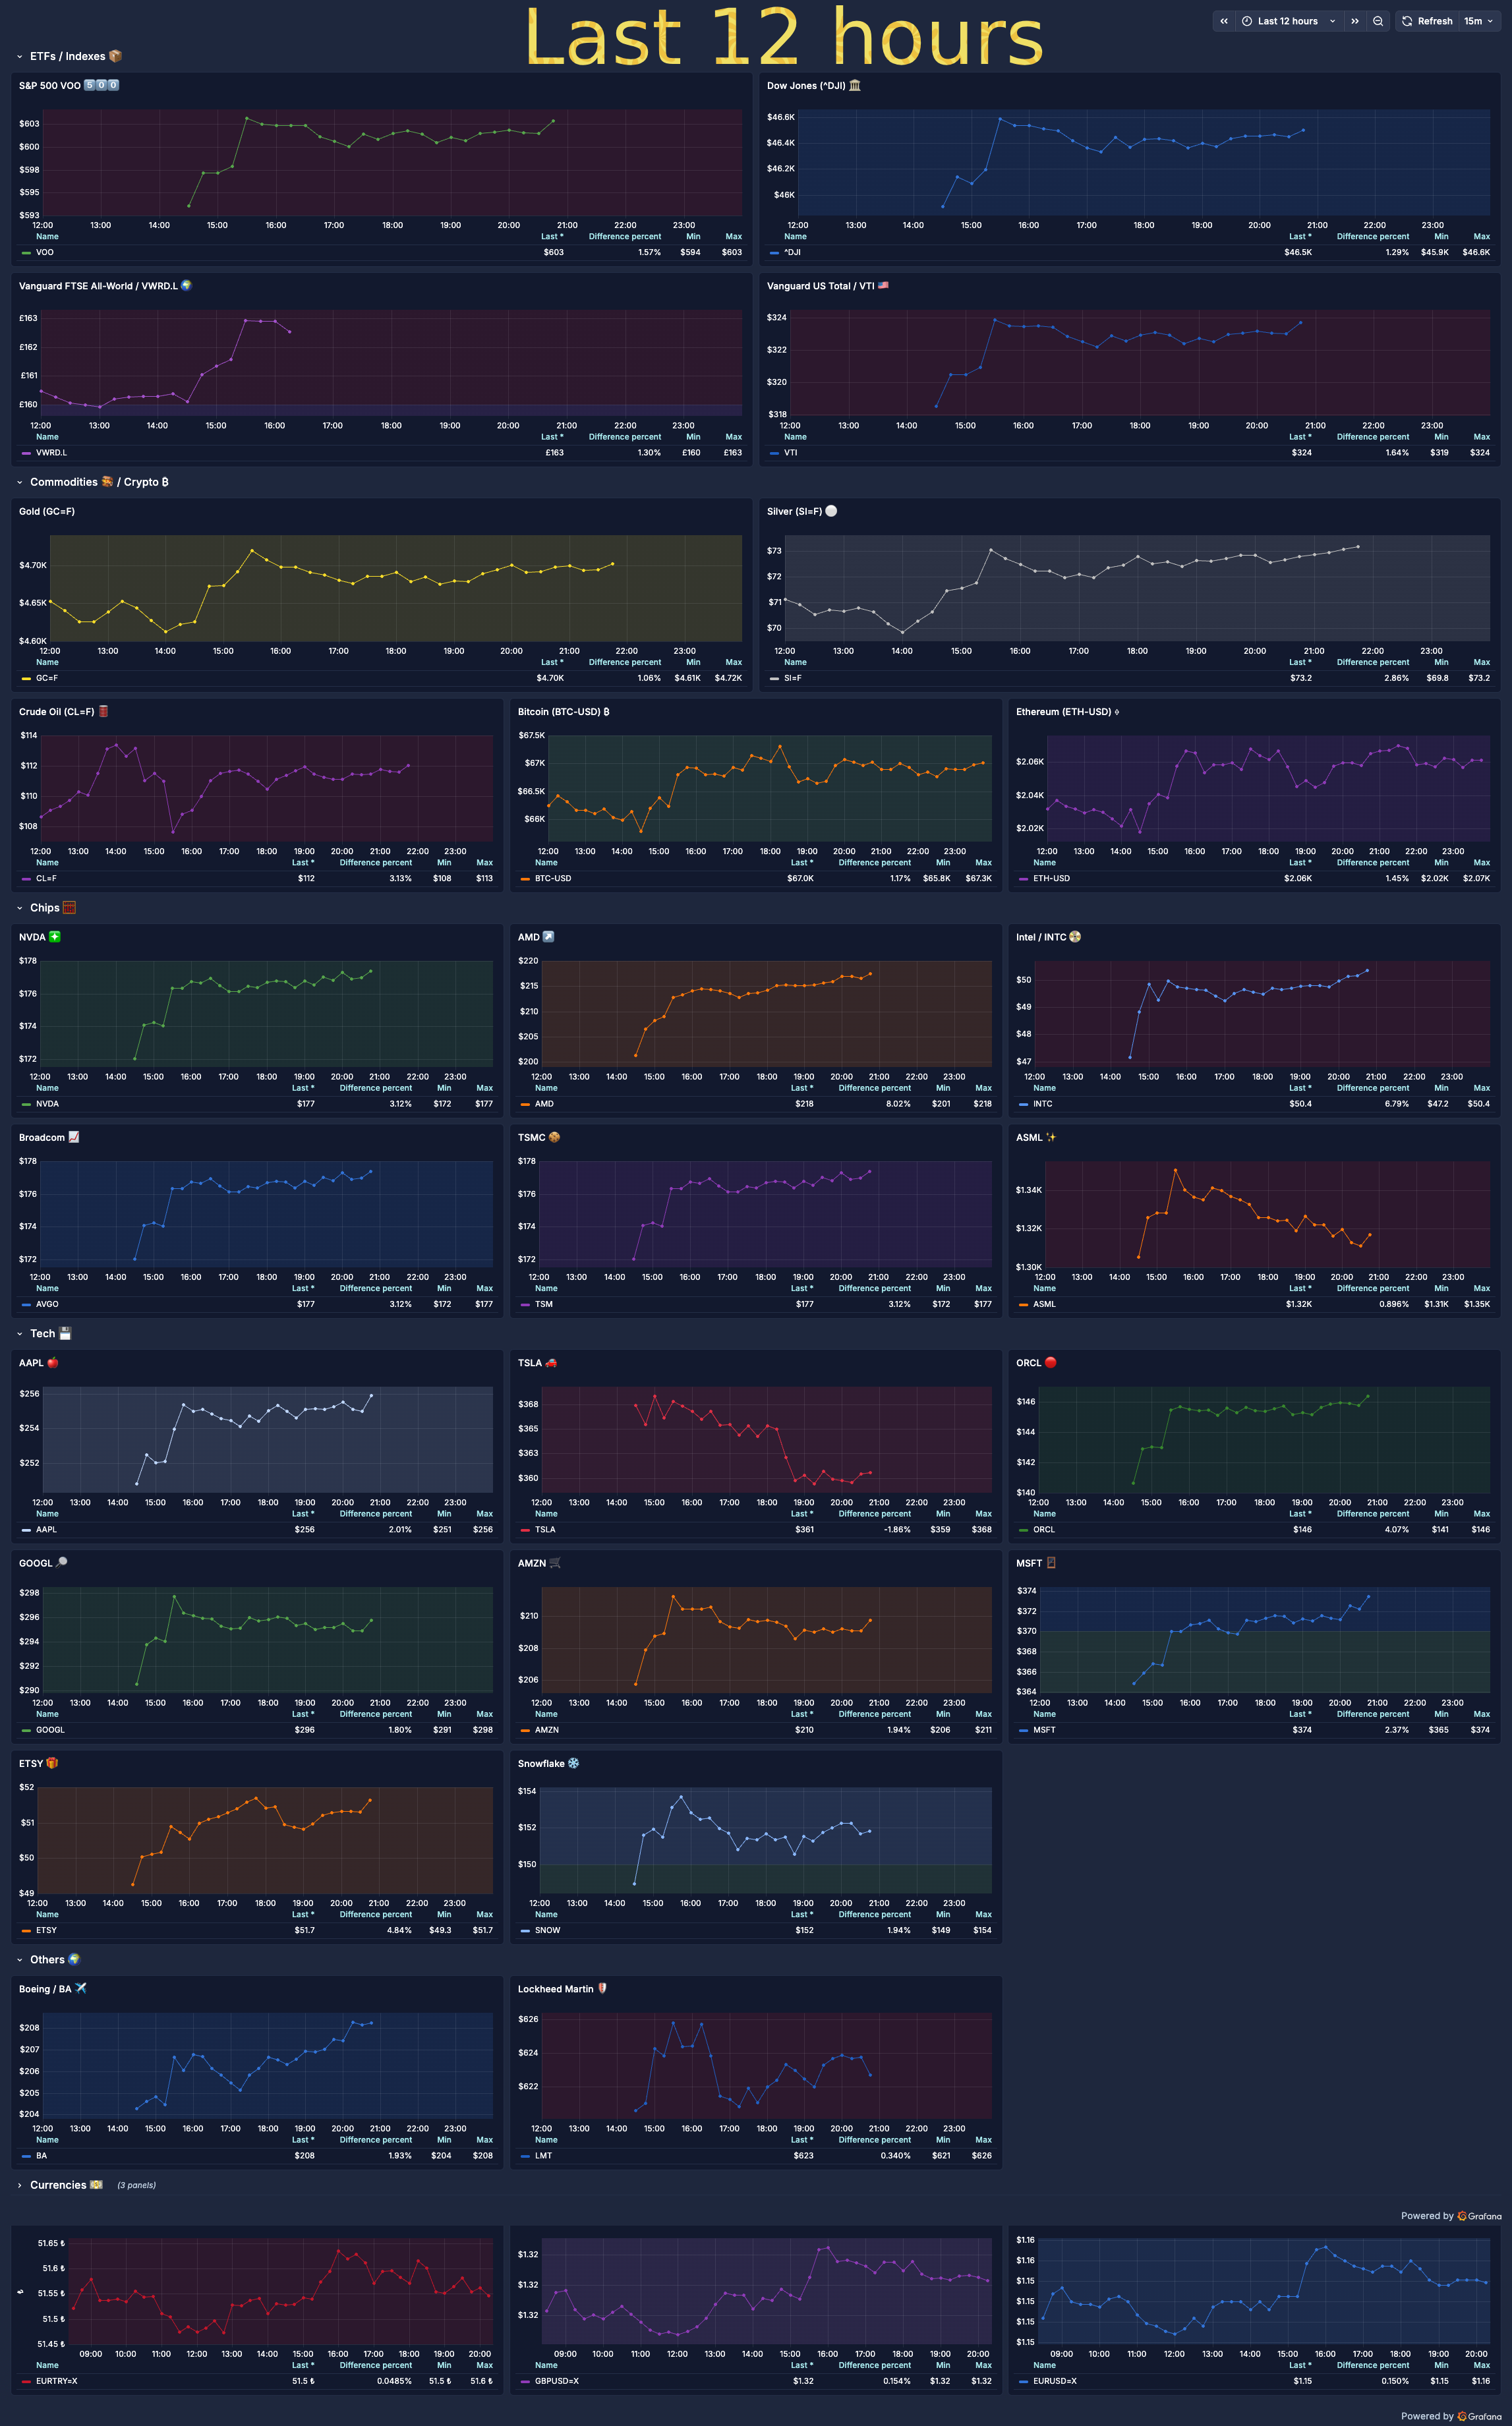
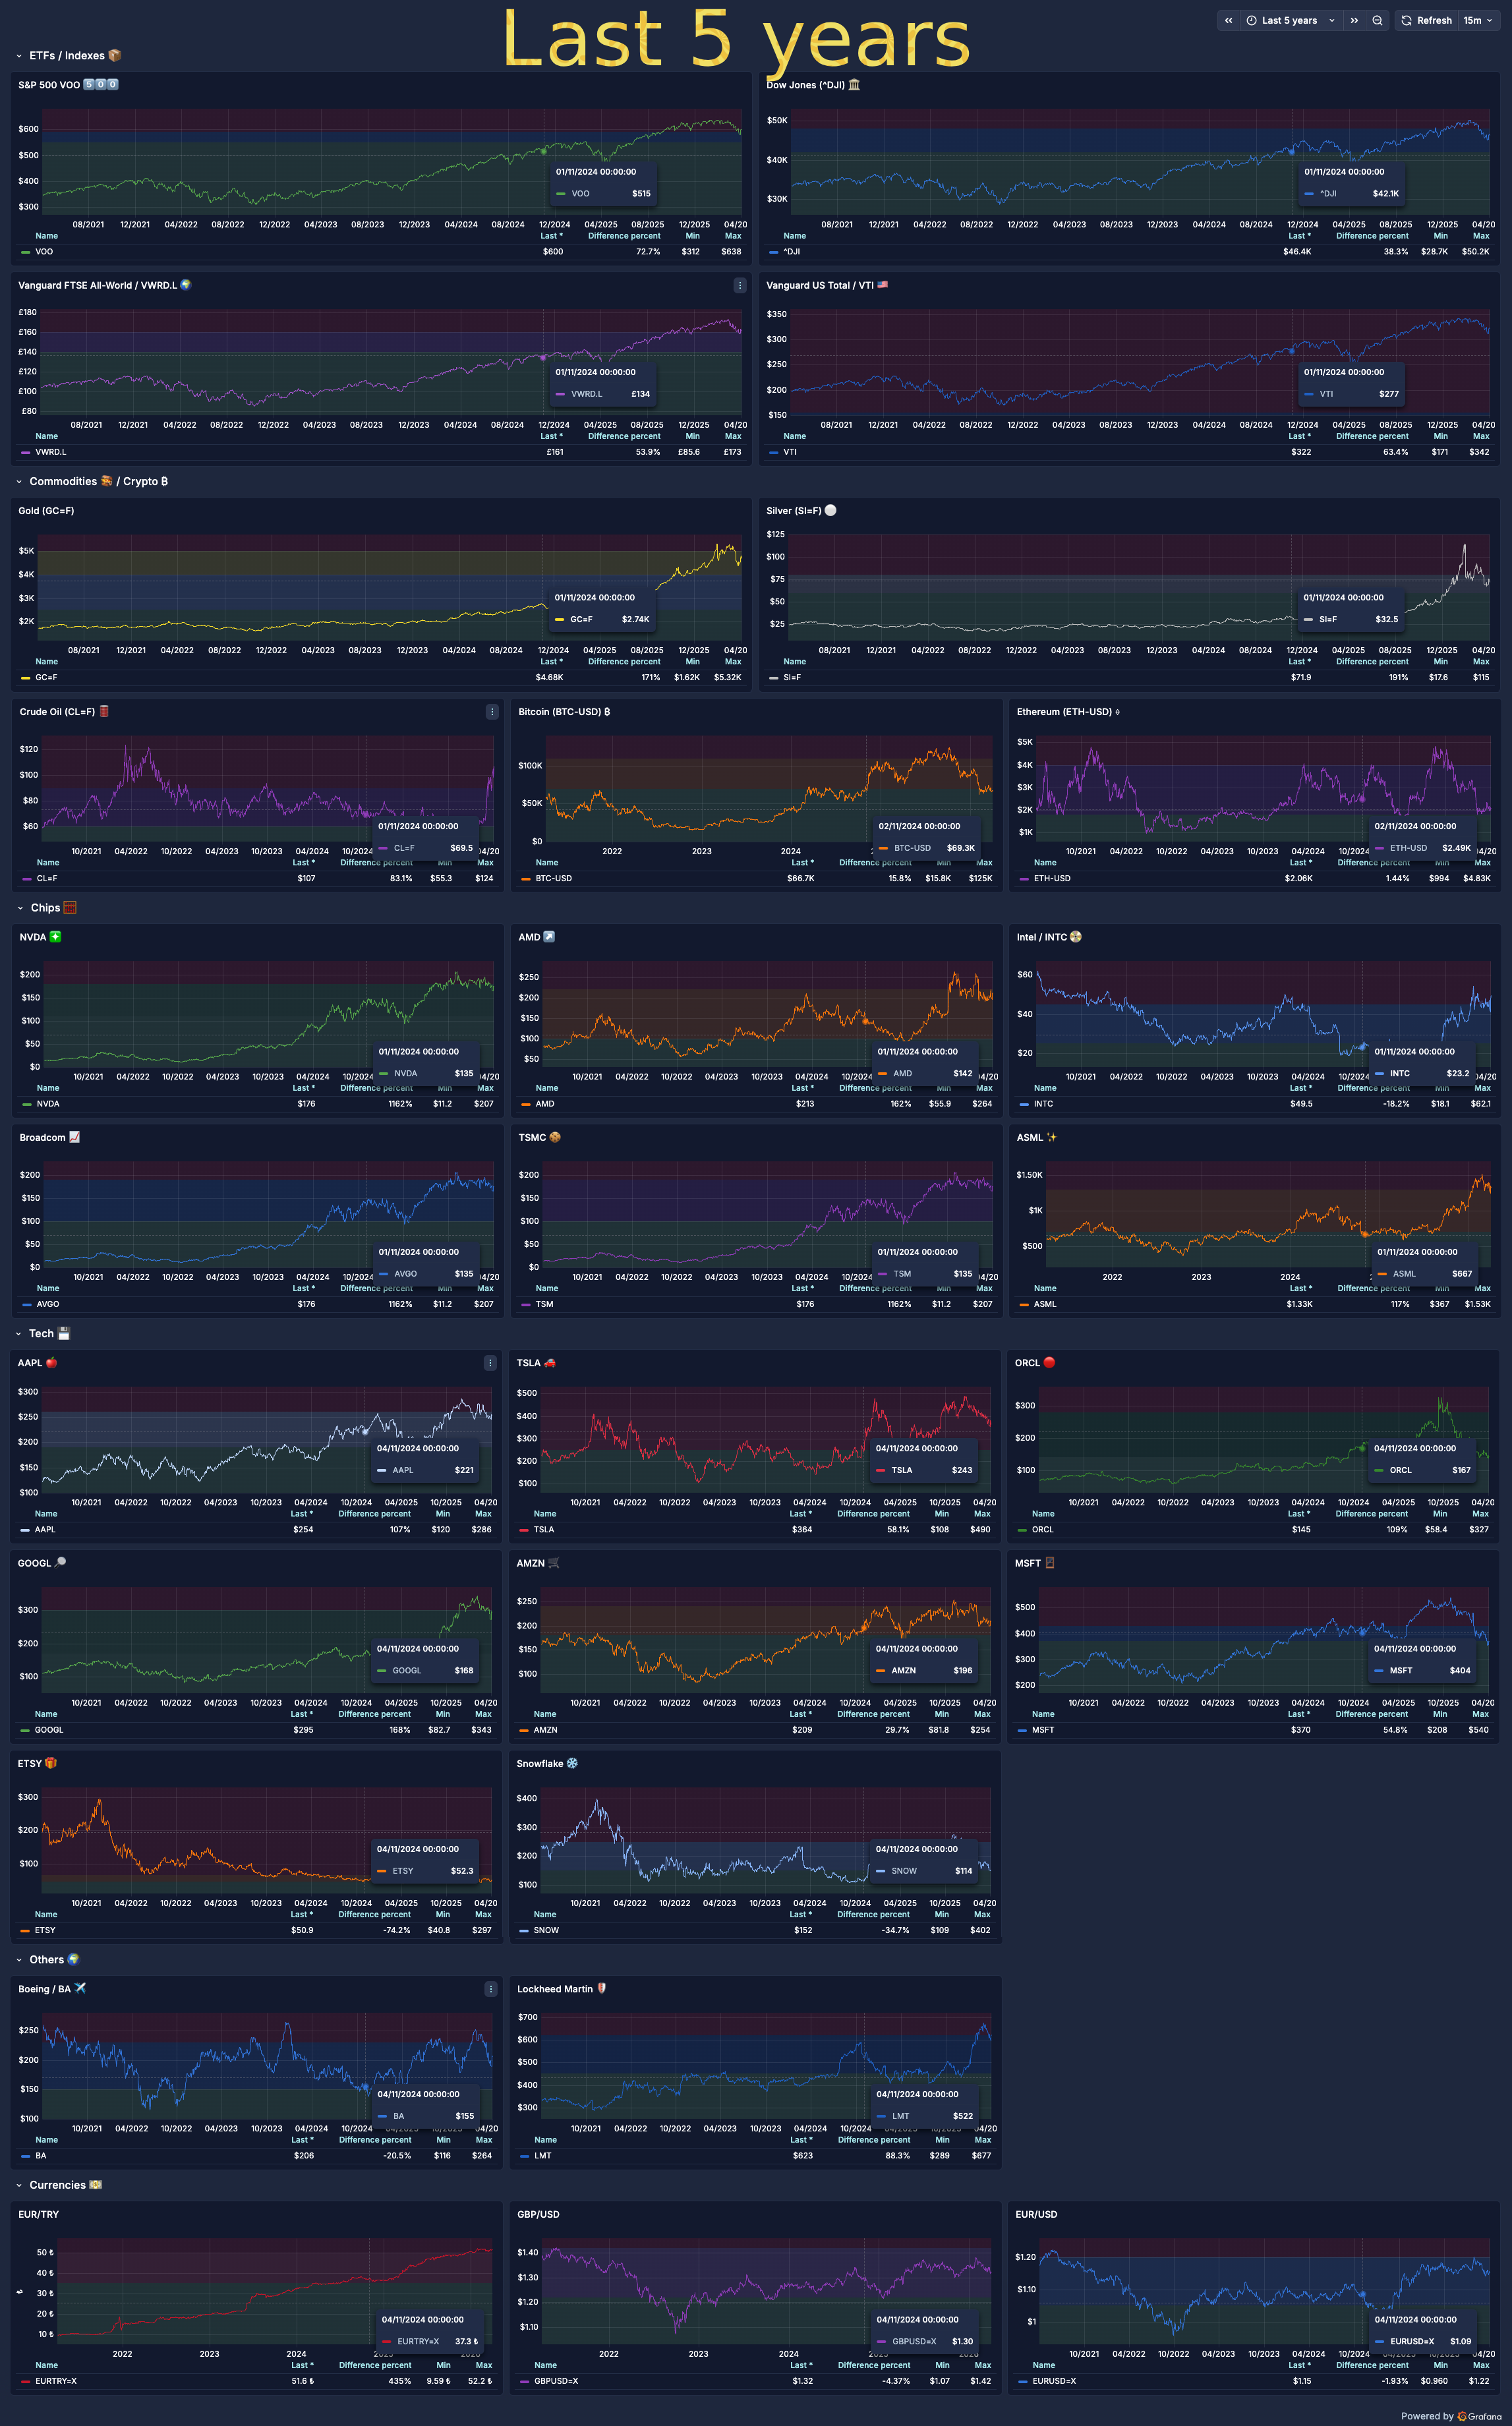
| Last 12 hours | Last 5 years |
|---|---|
 |
 |
The Problem
I wanted a single dashboard where I could see everything I track — S&P 500, gold, NVIDIA, Bitcoin, EUR/TRY — at a glance. Without stitching together free-tier widgets or juggling multiple apps. And I wanted history: not just today's price, but 5 or 10 years of data I can query however I like.
The usual approach is a cron job that dumps price data into a CSV or SQLite file. That works until you want real-time intraday views, automatic gap-filling, or dashboards that zoom seamlessly from a 5-year view down to 15-minute candles. So I built a proper stack.
What You Get
- Three Docker services — a Python worker, TimescaleDB, and Grafana. One
docker compose upand you're running. - 29 default symbols — US mega-caps, semiconductors, ETFs, commodities, forex, and crypto. Edit
config.yamlto track whatever you want. - Automatic backfill — on first run, the worker fetches up to 10 years of daily history per symbol.
- Two-tier data model — daily bars for history, 15-minute intraday bars for today, with automatic compaction.
- Pre-built Grafana dashboards — 5 sections (ETFs, Commodities, Chips, Tech, Currencies), shared crosshair, and example alert rules.
- Kubernetes-ready — Kustomize manifests with a StatefulSet for TimescaleDB, proper health gates, and ConfigMap-based config.
Two-Tier Data Model
The prices hypertable stores two kinds of rows distinguished by a granularity column:
daily— official end-of-day OHLCV bars. Kept forever. One row per symbol per day.intraday— 15-minute bars captured during polling. Kept for today only.
Compaction happens automatically. After each poll, the worker looks for symbols that have stale intraday rows from previous days — but only if the symbol already has new intraday data from today (this prevents premature cleanup on restarts). For each stale entry, it fetches the official daily bar, inserts it, and deletes the old intraday rows. The dedup guarantee is a unique index on (symbol, time, granularity) with ON CONFLICT DO NOTHING.
How the Worker Operates
The worker lifecycle has three phases:
- Backfill — on startup, for each symbol, fill daily gaps since the last known timestamp. If the database is empty, fetch the full history (default 10 years). Also fetch today's full intraday data.
- Poll — every 15 minutes (configurable per-symbol), batch-download the latest 15-minute bars for all symbols in a single
yfinancecall and insert them as intraday rows. - Compact — after each poll, check for markets that have closed and convert their intraday data to daily.
A nice side-effect of fetching the full day's intraday data on each poll: if the worker was down for hours (laptop asleep, pod restart), the next poll automatically backfills the gap. No special recovery logic needed — ON CONFLICT DO NOTHING handles the overlap.
The Dashboard
The Grafana dashboard ships pre-provisioned with 5 collapsible sections:
- ETFs / Indexes — VOO, ^DJI, VWRD.L, VTI
- Commodities / Crypto — Gold, Silver, Crude Oil, BTC, ETH
- Chips — NVDA, AMD, INTC, Broadcom, TSMC, ASML
- Tech — AAPL, TSLA, ORCL, GOOGL, AMZN, MSFT, ETSY, SNOW
- Others / Currencies — Boeing, Lockheed Martin, EUR/TRY, GBP/USD, EUR/USD
Shared crosshair is enabled across all panels — hover on one and the cursor syncs everywhere. Two example alert rules ship paused: a gold price threshold and a no-data alert.
Running It
cp config.example.yaml config.yaml   # customize your symbols
cp .env.example .env                  # set DB credentials
docker compose up
Grafana is at http://localhost:3000 with anonymous admin access. The worker starts backfilling immediately — give it a minute for history to populate, then the dashboard lights up.
For Kubernetes, the k8s/ directory has Kustomize manifests with a base/overlay structure. make -C k8s apply-prod deploys everything. The worker image builds via CI and pushes to GHCR.
GitHub: github.com/atas/markets-o11y